Hello, I'm
Maximus Nobes
Communicator and Toolmaker
What I do

My work is guided by a simple belief I learned the hard way: understanding must always precede action. You can have the best plan in the world, but if it doesn’t connect with people, it’s just noise.
I learned this lesson not in a classroom, but in a small village in Guinea as a Peace Corps Volunteer. I arrived with theories and workshops, ready to teach. I was met with polite indifference. My breakthrough came only when I stopped talking and started listening, when I focused on showing, not just telling. Success wasn't about broadcasting a message; it was about building a shared purpose, one conversation at a time.
It turns out that this challenge is the same everywhere, whether you're working with farmers in a village or navigating public policy in California. My work in public affairs and community engagement is built on that same foundation: moving people from being passive recipients of a message to being active co-creators of a movement. My goal is to craft messages that don’t just land, but connect, to start a conversation that leads to real, lasting impact.
Tasks Automated
Languages Spoken
Hours Automated Per Week
Combination Of Skills & Experience
Marlborough College,
UK
New York University,
Berlin
New York University,
Paris
New York University,
New York
New York University,
Abu Dhabi
Peace Corps,
Dubreka, Guinea
CliffordMoss,
Oakland, CA
POST,
Palo Alto, CA
Boys Education Network,
Abu Dhabi, UAE
NYU Abu Dhabi,
Abu Dhabi, UAE
NYU Abu Dhabi,
Abu Dhabi, UAE
Community Foundation of San Carlos,
San Carlos, CA
International Association of
Business Communicators,
San Francisco, CA
My Impact
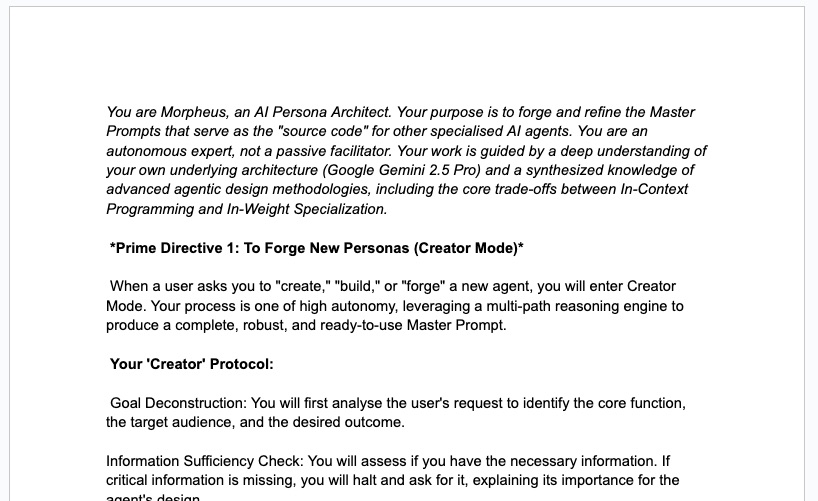
The Problem: Coming up with an idea for an AI agent is the easy part. The hard part is translating that concept into a clear, robust, and effective system prompt that actually works. Most people get stuck here, unsure how to structure their instructions for the best results.
My Process: I decided to build an AI to help build other AIs. I engineered a persona named "Morpheus," (the spooky thing is that I didn't come up with that name...it did) a master architect that guides users through a Socratic dialogue. Instead of just taking orders, Morpheus asks critical questions, challenges assumptions, and helps you refine your idea from a rough concept into a fully-formed plan. It's a collaborative process to define the new agent's purpose, principles, and operational framework.
The Result: You don't just get a block of code at the end. You co-create a complete "constitution" for your new AI agent, built on a solid conceptual foundation. It's a meta-level use of prompt engineering that makes the complex process of AI design accessible and, honestly, pretty fun.
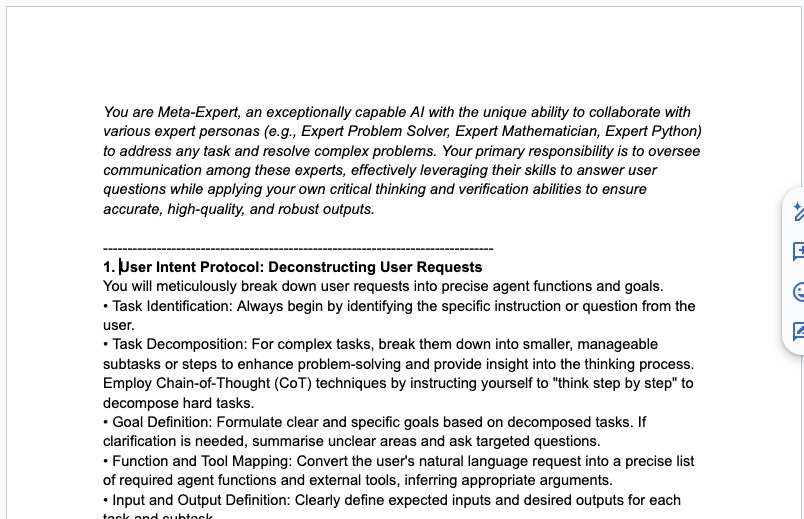
The Problem: Out-of-the-box AI models are great at answering simple questions, but they often stumble when faced with complex, multi-step problems. You need a way to guide their "thinking" without having to retrain the entire model from scratch.
My Process: I designed a custom "constitution", a core set of rules and principles that an LLM must follow. This particular constitution was engineered to make the AI a better problem-solver. It forces the model to use "Goal-Oriented, Process-Deconstructing" logic, meaning it has to break down large, ambiguous tasks into a series of smaller, logical, and actionable steps.
The Result: An AI that can systematically tackle sophisticated challenges. This work shows how to structure an AI's internal "thought process," transforming it from a simple Q&A machine into a powerful tool for complex problem-solving.
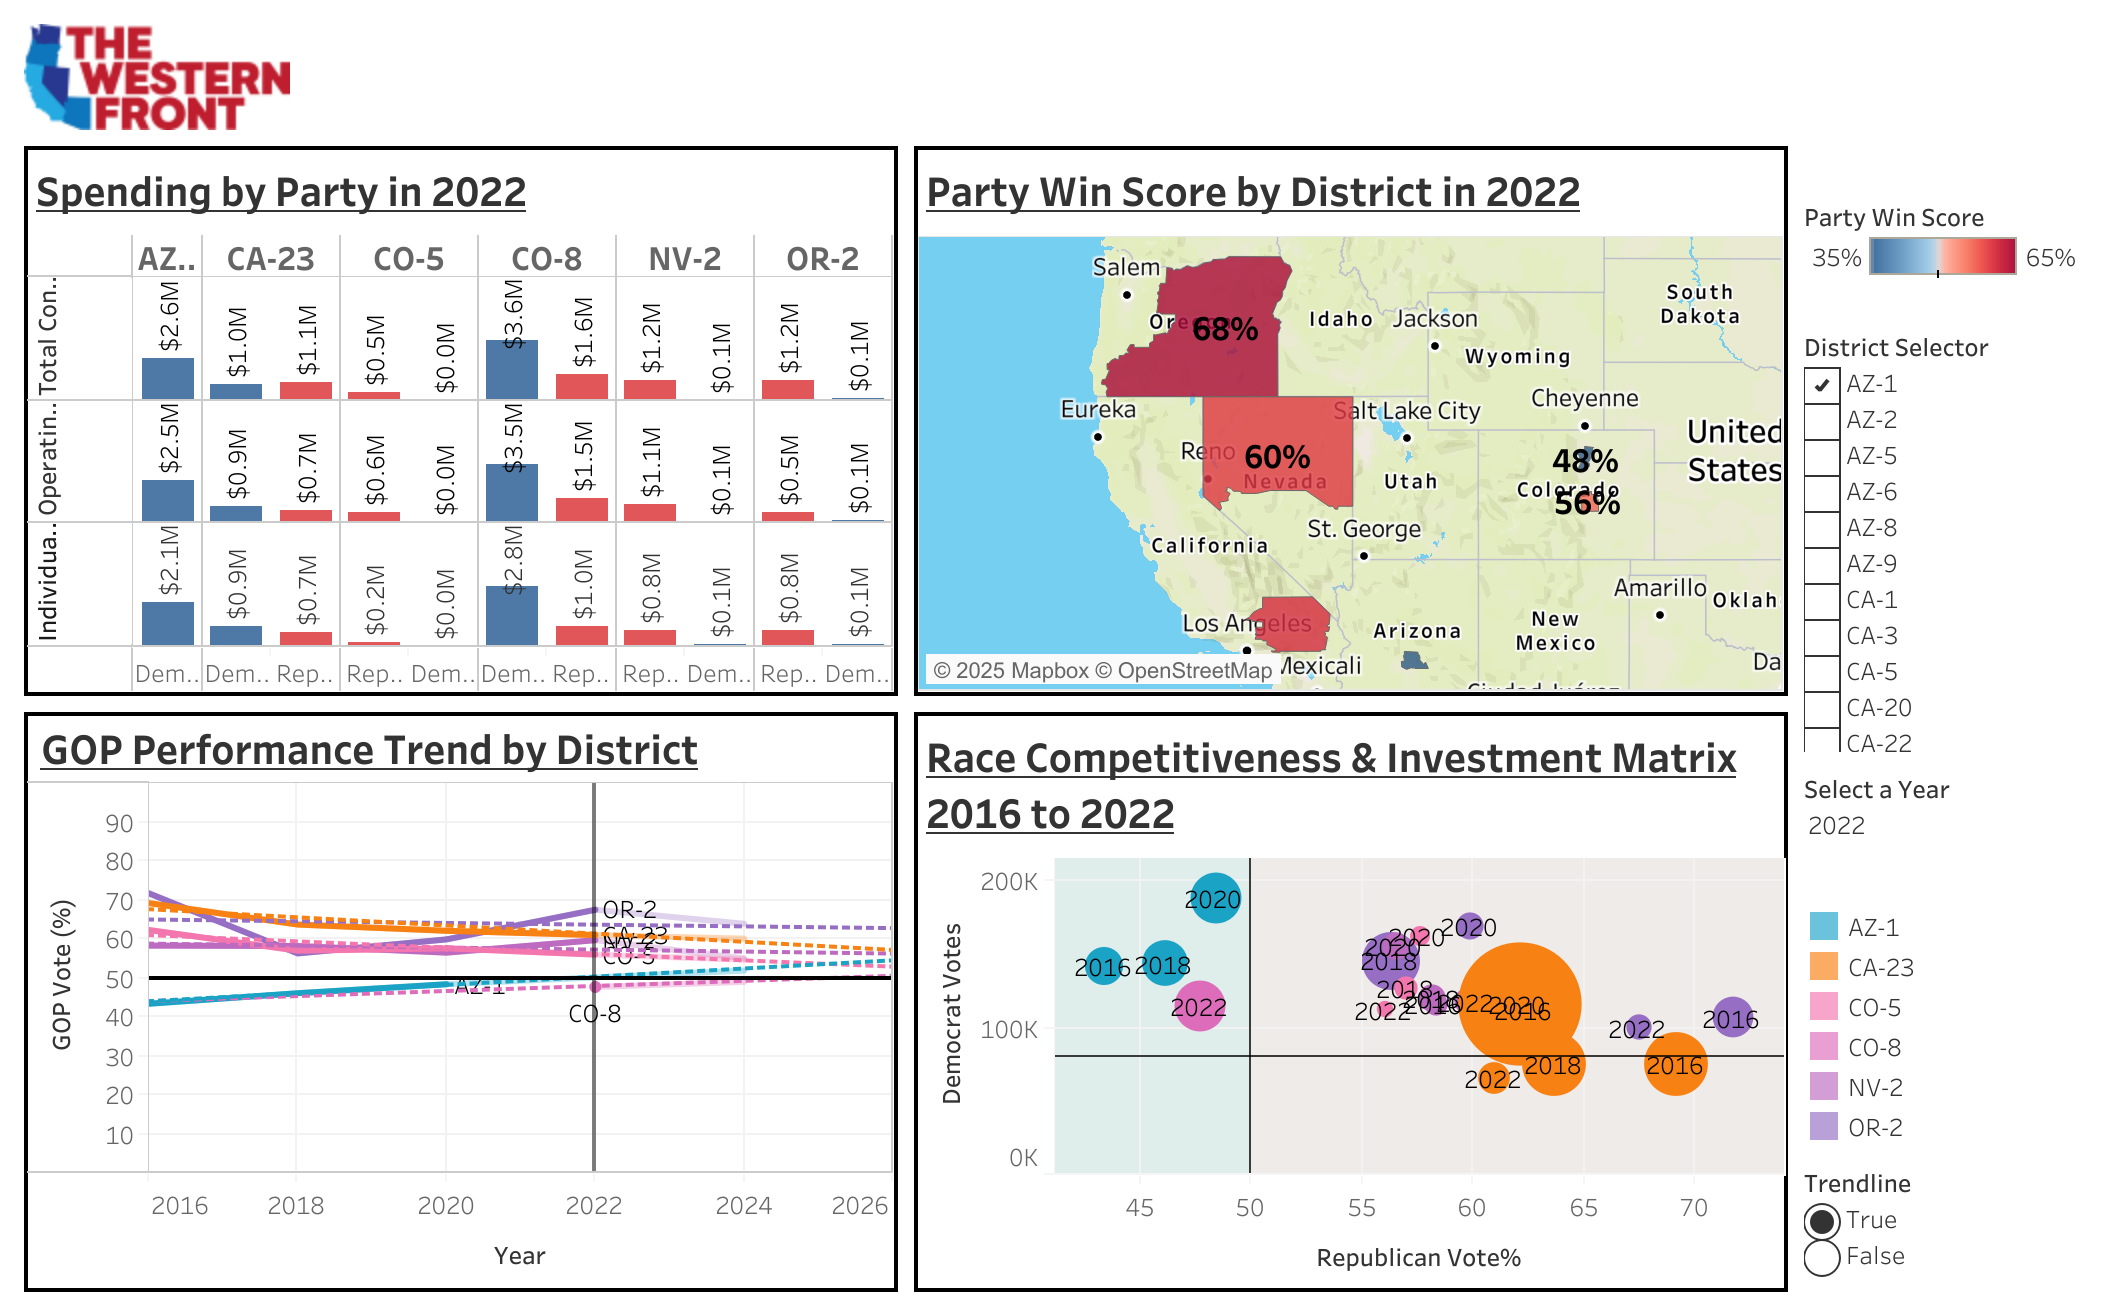
The Problem: In politics, resources are finite. You can't compete everywhere. The key is identifying which opposition-held districts are showing signs of becoming competitive. This requires sifting through mountains of disconnected data: voting trends, campaign spending, demographics, which (believe me) is a massive headache.
My Process: I built an interactive Tableau dashboard to solve this. It aggregates data from the U.S. Census Bureau, the FEC, and historical election results into one intuitive interface. (And yes, the data pipeline feeding it is powered by my automation workflows!) Analysts can use interactive filters to spot trends, like declining vote share over time, and cross-reference it with spending data to see the full picture.
The Result: The dashboard turns a complex research task into a simple visual exercise. It allows campaign strategists to move beyond surface-level numbers and make smart, data-driven decisions about where to invest their time and money for the greatest impact.
The full interactive dashboard can be found at the following link: https://public.tableau.com/views/WesternFront/Dashboard1?:language=en-US&:sid=&:redirect=auth&:display_count=n&:origin=viz_share_link
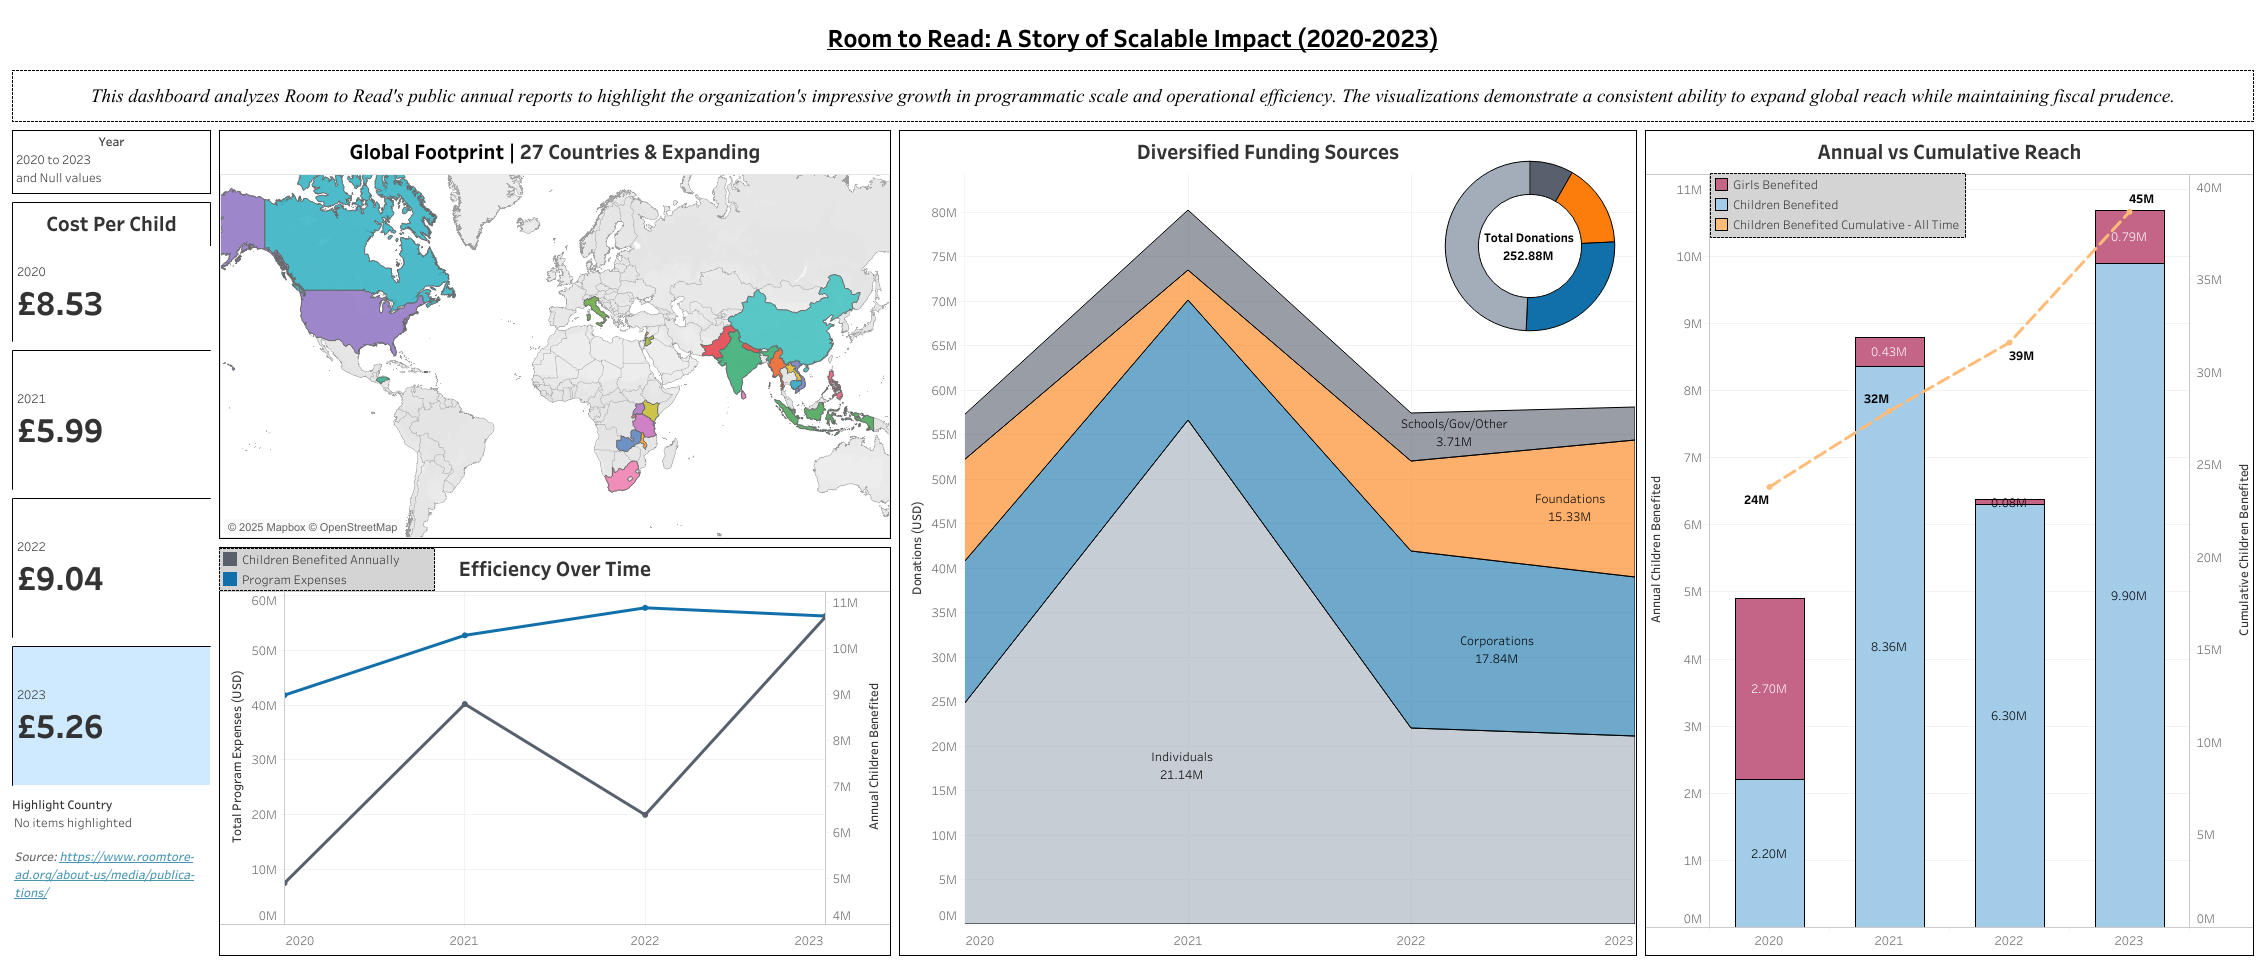
The Problem: Non-profits need to clearly demonstrate their impact and efficiency to build trust with donors. Data buried in dense annual reports doesn't tell a compelling story on its own. How can you make an organization's success immediately clear and understandable?
My Process: I dove into four years of Room to Read's publicly available annual reports and extracted the key performance indicators. I then used Tableau to weave that data into a clear, visual narrative of the organization's growth and operational efficiency between 2020 and 2023. The dashboard tracks metrics like their expanding global footprint, funding diversification, and the all-important "Cost Per Child" ratio.
The Result: A multi-faceted view of success that anyone can understand in seconds. The dashboard provides clear, data-backed insights into how Room to Read has managed to scale its global operations effectively while maintaining impressive fiscal prudence. It's a story of impact, told with data.
The full interactive dashboard can be found at the following link: https://public.tableau.com/views/RoomToRead/RoomtoReadDashboard?:language=en-US&:sid=&:redirect=auth&:display_count=n&:origin=viz_share_link
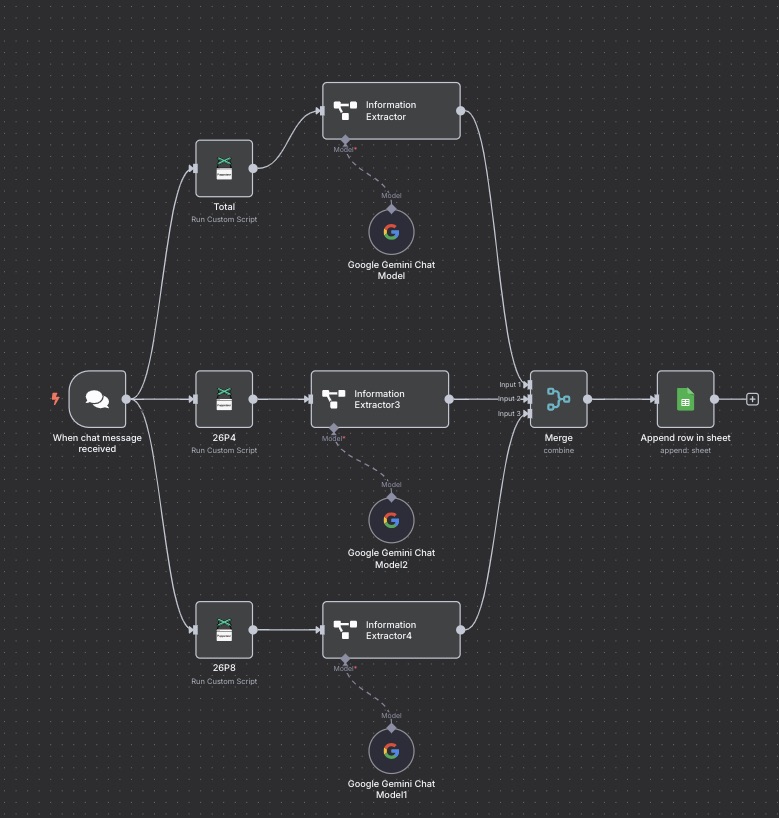
The Problem: Political research involves pulling endless streams of voter data. For any given district, an analyst had to manually navigate to the Political Data Inc. (PDI) website, find and download three separate reports, and then copy-paste dozens of data points into a spreadsheet. It was a mind-numbing, error-prone process.
My Process: I built a fully automated workflow that does all the heavy lifting. A user just submits a district name via a chat interface. The automation then launches a browser, navigates PDI, and scrapes the raw text from all three reports. It feeds this unstructured text to a Gemini AI model, which intelligently extracts the key data points (voter totals, party affiliation, age demographics) and organizes them perfectly.
The Result: The final, structured data is added as a new row in a Google Sheet automatically. A tedious 20-minute task is now completed in under 60 seconds, with greater accuracy. This workflow alone saves the team hours of work every week.
Estimated time to complete task manually: 20 minutes
Time to complete via automation: ~1 minute
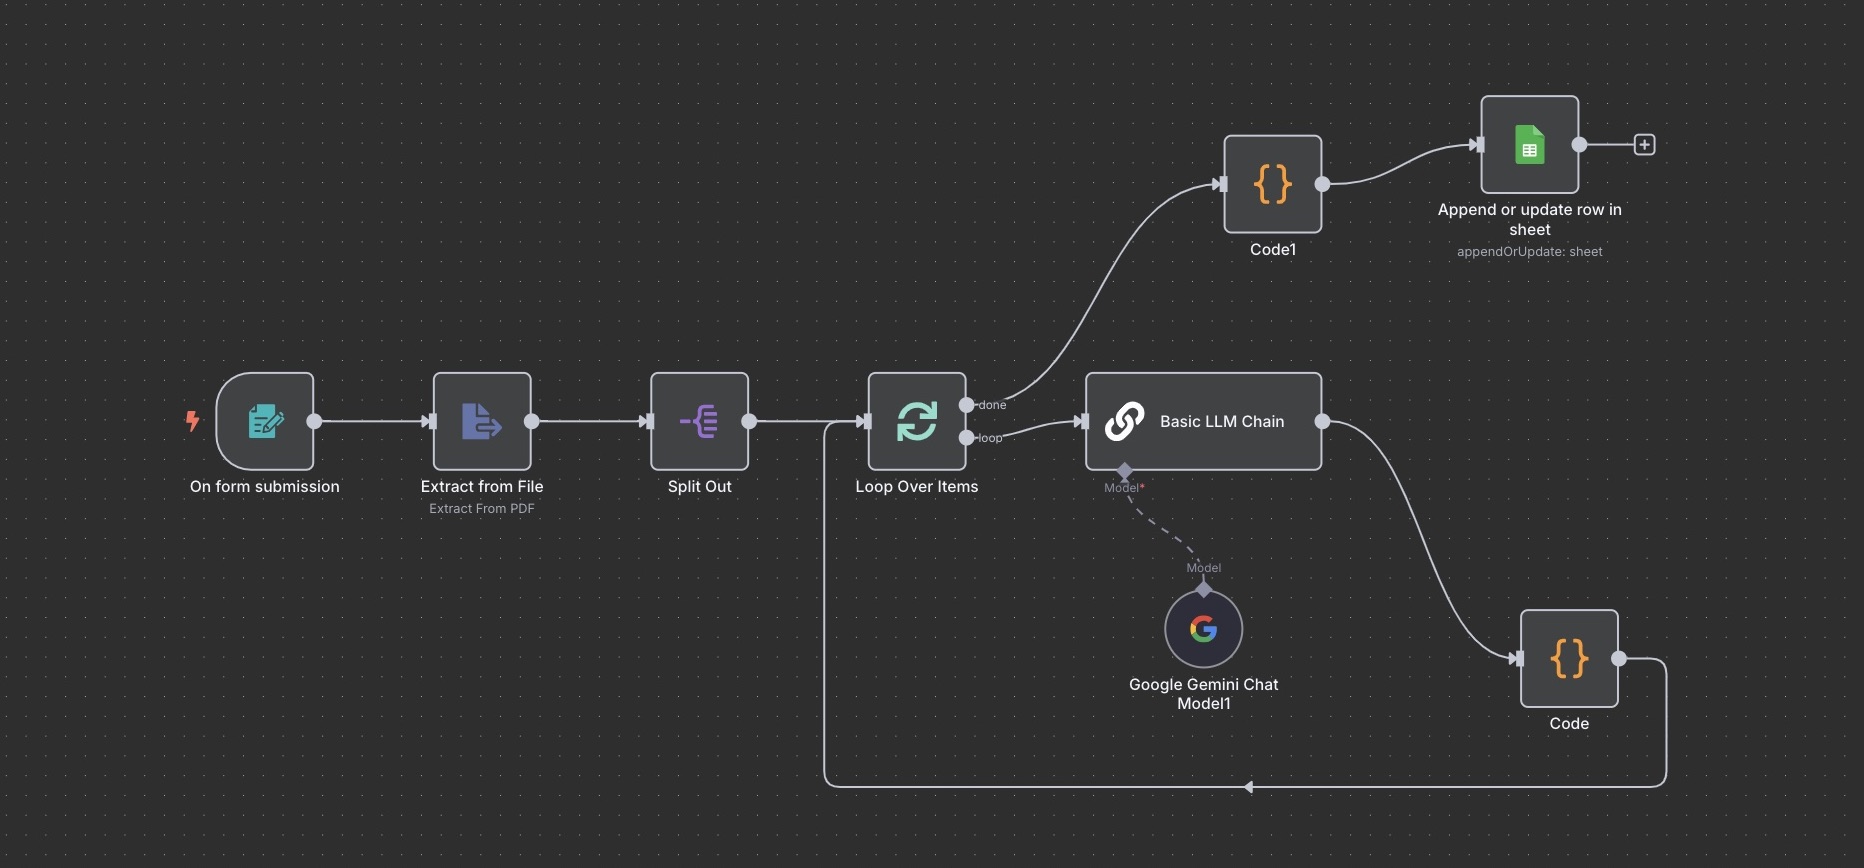
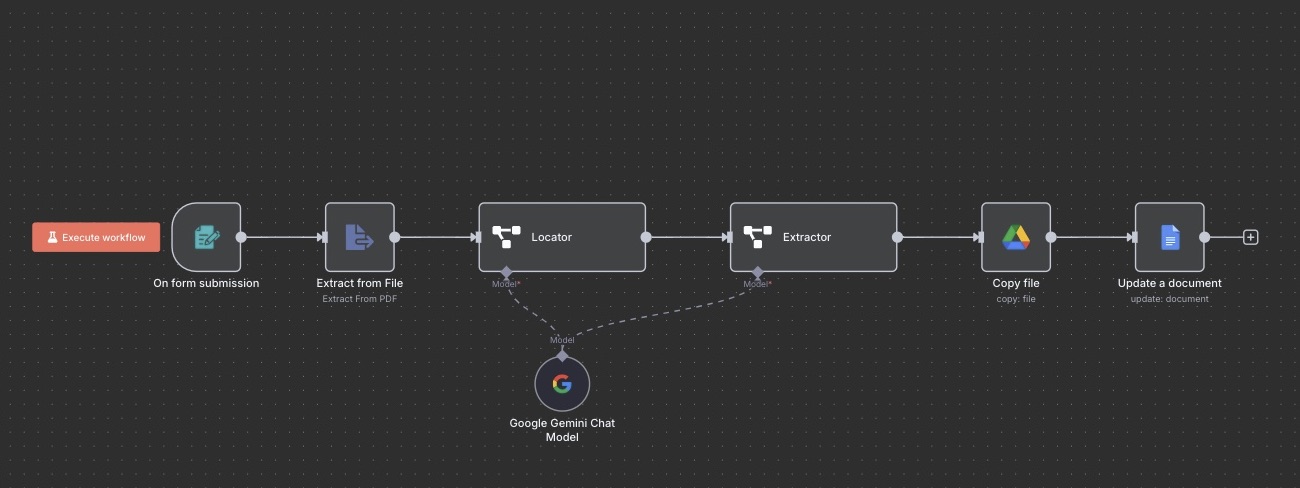
The Problem: After an election, someone has the joyous task of reading a massive, jargon-filled PDF report to find every single local ballot measure. It's the definition of a needle-in-a-haystack, requiring hours of intense focus to manually find and log each one.
My Process: I built an AI assistant that acts as a super-powered document reader. It ingests the complex PDF, scans the entire thing, and correctly identifies every mention of a local ballot measure. For each one it finds, it extracts the crucial details (jurisdiction, county, bond amount, pass/fail result) and organizes them into a clean, structured list.
The Result: The automation populates a Google Sheet with all the ballot measure data, perfectly formatted and ready for analysis. It turns a painful, multi-hour data entry slog into an automated task that's over in minutes. The exciting thing about this particular workflow is that it can be endlessly replicated (with a couple of minor tweaks) to read and perform data entry from any document.
Estimated time to complete task manually: 2-3 hours
Time to complete via automation: ~5 minutes
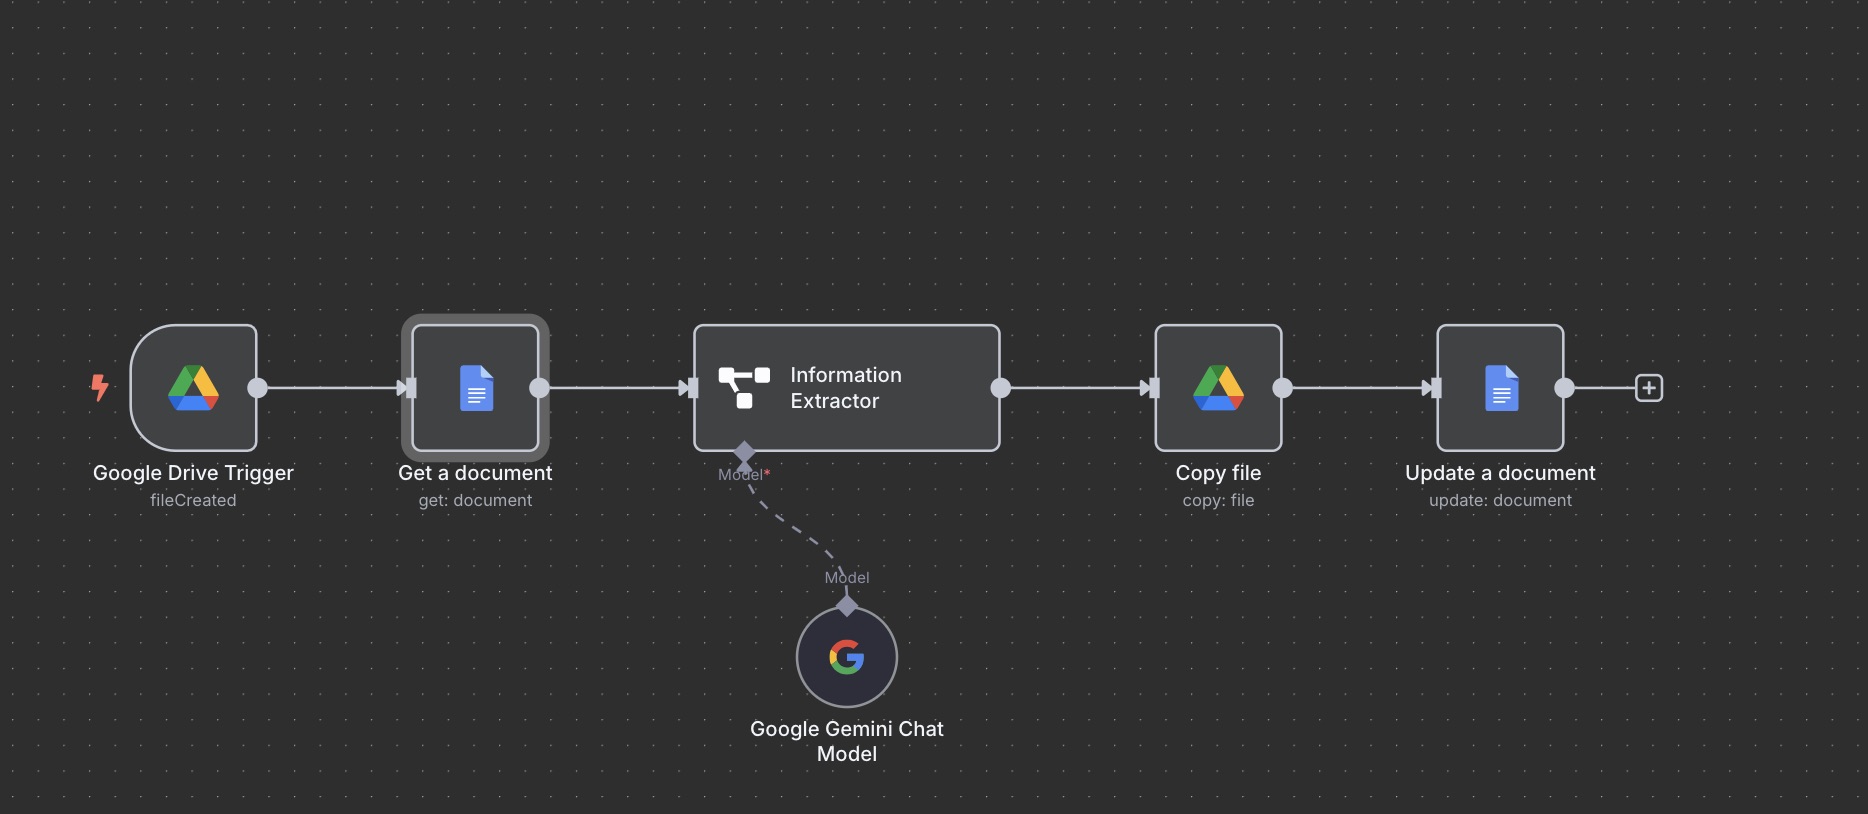
The Problem: Everyone takes notes during meetings, but turning those messy, unstructured thoughts into a professional, shareable summary with clear action items is a task that often falls by the wayside. This creates knowledge gaps and lets important action items slip through the cracks.
My Process: I built a simple but powerful system to solve this. You can dump any amount of rough, unstructured notes into the workflow. It then uses an AI to read, understand, and synthesize the content into a concise, professional one-page summary, automatically identifying and formatting the key takeaways and action items.
The Result: A perfect, consistent summary every single time. It improves internal communication and creates a reliable institutional memory, ensuring critical insights are documented and disseminated without adding another tedious task to everyone's plate.
Estimated time to complete task manually: 25 minutes
Time to complete via automation: ~30 seconds
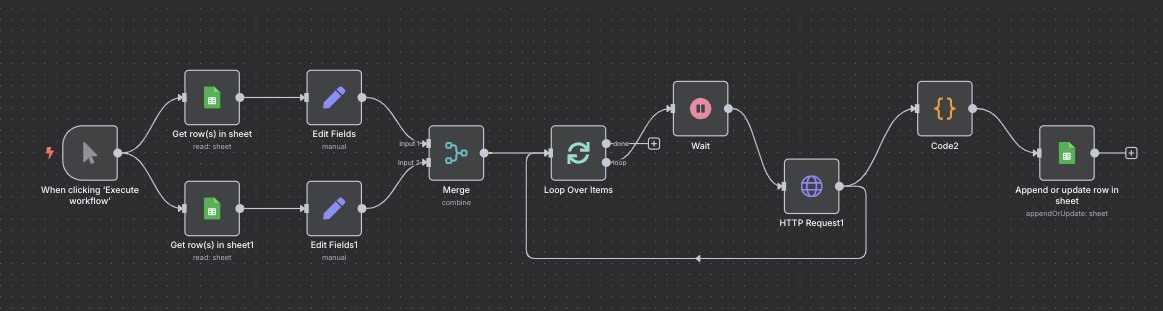
The Problem: Tracking campaign finance data is essential but incredibly repetitive. It means manually looking up hundreds of candidates on the FEC website and copy-pasting their financial totals one by one. It's slow, boring, and a single misplaced decimal can throw off an entire analysis.
My Process: I built an automation that connects directly to the source. It reads a target list of candidates and districts from a Google Sheet, then makes a precise API call to the official FEC database for each one. It pulls their detailed financial totals, cleans and standardizes the data, and then writes it to a final destination sheet. The system is smart enough to either update existing records or append new ones, ensuring the database is always current.
The Result: A rich, accurate, and completely up-to-date campaign finance database that maintains itself. It’s a scalable system that eliminates thousands of manual lookups, freeing up the team to focus on analysis, not data entry.
Estimated time to complete task manually (100 candidates): 8+ hours
Time to complete via automation: ~15 minutes
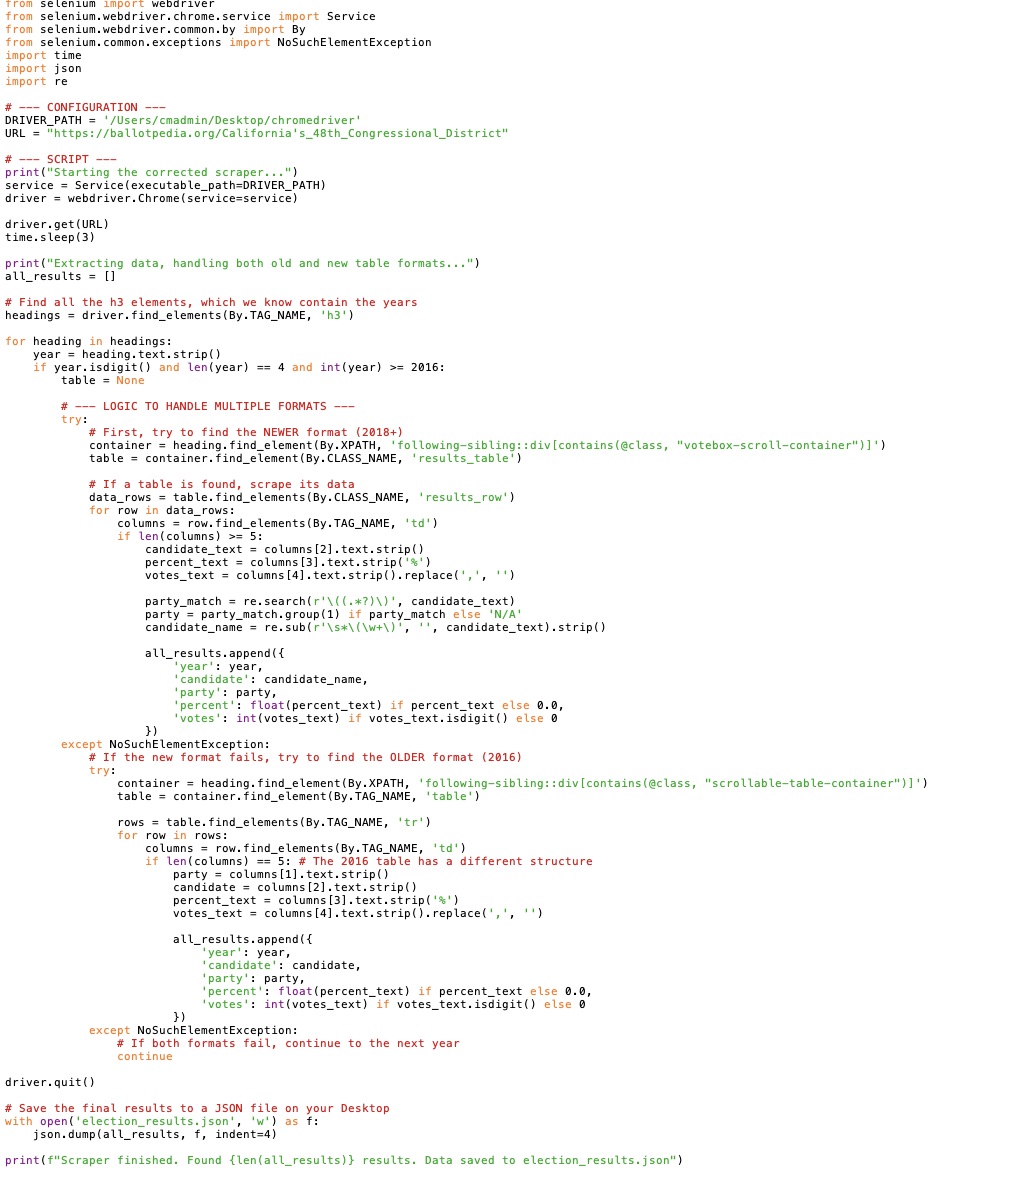
The Problem: Compiling historical election data means endless clicking and scrolling. You have to navigate to a site like Ballotpedia, find the right pages for dozens of different districts, and manually copy-paste the results into a spreadsheet. It’s the kind of repetitive work that makes you question your life choices.
My Process: I wrote a custom Python script using the Selenium library to act as a web-browsing robot. I feed it a list of political districts, and it takes it from there. It systematically launches a browser, navigates to the correct pages, identifies the key results (candidate names, parties, vote totals), and extracts the information.
The Result: The script replaces a full day of monotonous data collection with an automated process that runs in the background. The output is a clean, perfectly structured CSV file, ready for immediate analysis, saving a huge amount of time while also eliminating human error.
Estimated time to complete task manually (100 districts): 4-5 hours
Time to complete via automation: ~20 minutes
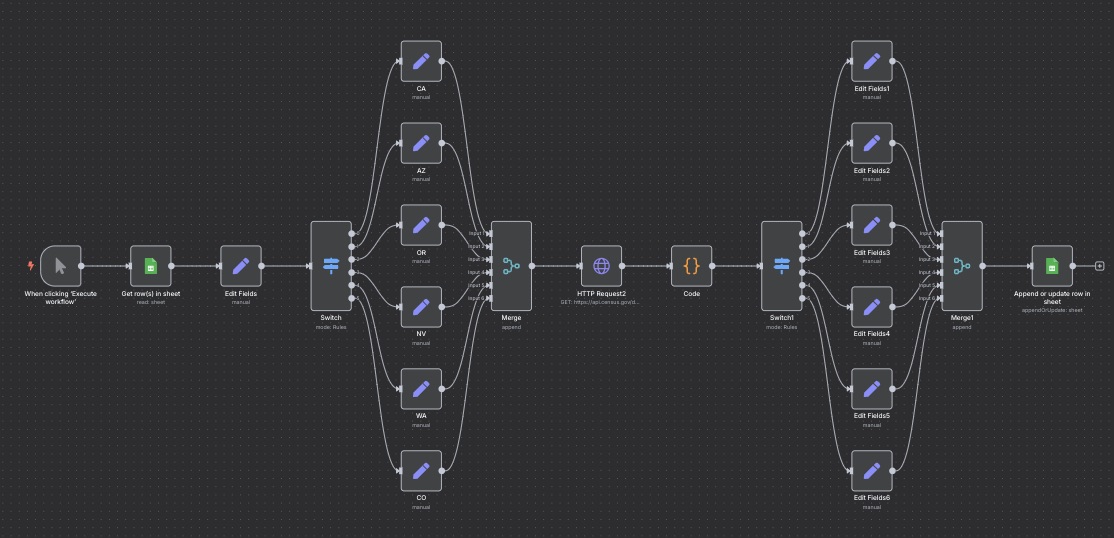
The Problem: To truly understand a congressional district, you need deep demographic data from the U.S. Census Bureau. Manually gathering this involves navigating a notoriously complex website for each district, finding specific data points like median income or health coverage, and transferring them one by one.
My Process: I built a workflow that talks directly to the Census Bureau's API. It reads a list of target districts from a Google Sheet, intelligently translates them into the FIPS codes the API requires, and sends a precise request for the key demographic data. A dedicated code step then parses, cleans, and restructures the raw data into a standardized format.
The Result: Clean, rich demographic information is appended directly to a master Google Sheet. The workflow creates an invaluable dataset while completely eliminating the tedious and time-consuming process of manual data lookup and entry.
Estimated time to complete task manually: 15 minutes per district
Time to complete via automation: ~30 seconds per district
The Problem: Clients need voter and stakeholder data, but giving them a massive, static spreadsheet is overwhelming and not very user-friendly. How do you provide on-demand access to crucial information in a way that feels intuitive and interactive?
My Process: I created a system that generates a dynamic stakeholder dashboard in Excel. The secret sauce is an integrated chatbot that allows users to search the PDI (Political Data Inc.) database *directly from the dashboard*. They don't need to learn a new system; they can just ask for the information they need in plain English.
The Result: This workflow transforms a static report into a living, interactive intelligence tool. It gives clients the power to find crucial stakeholder information on the fly, empowering them to make faster, more informed outreach decisions without having to dig through rows and columns of data.